Datadog APM for Rails on Heroku

Application performance monitoring (APM) is critical for understanding how a web application behaves in production. While Heroku provides basic metrics such as memory usage and CPU load, this is not enough for in-depth analysis of what's happening inside a Rails controller or background job. Such as what database queries are running, Redis access, how much time is spent waiting for external services, etc. This is why an APM tool is needed.
Heroku makes it easy to add some APMs such as NewRelic or Scout APM with a one-click add-on, but sometimes, your company may already be using Datadog on other projects or teams. Integrating everything into the same observability tool keeps things consistent, simplifies cross-project monitoring, and leverages existing Datadog dashboards.
This post will walk through setting up Datadog APM on a Heroku-hosted Rails application. From my experience in going through this setup, I found Datadog's documentation occasionally lacking visibility on specific options. However, their customer support team was very helpful in answering my questions, usually within the same day or the next.
Assumptions: This guide assumes familiarity with deploying and managing a Rails on Heroku, along with having the Heroku CLI installed and authenticated.
High Level
Before getting into the step-by-step installation details, let's take a look at the overall picture:
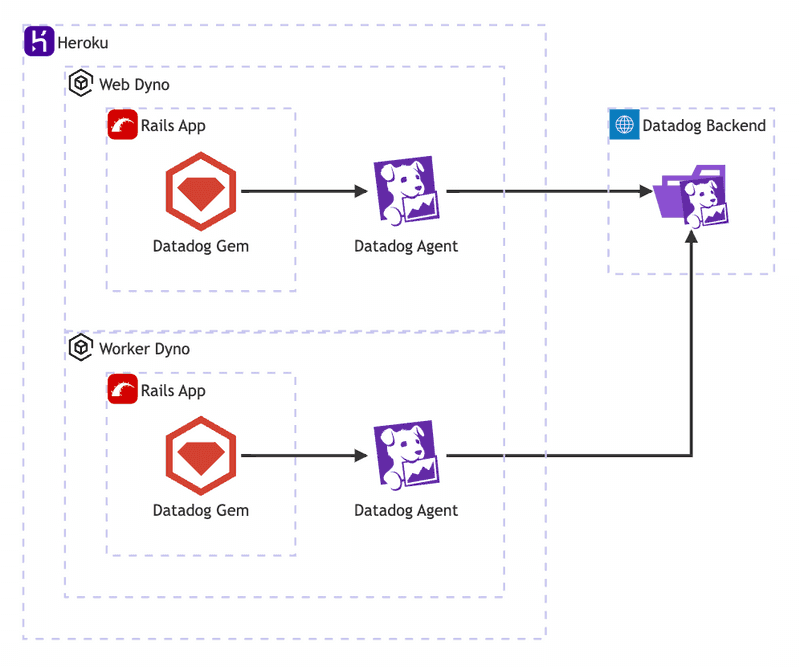
Heroku provides both web and worker dynos, where your Rails app runs. For Datadog to capture trace data and metrics, you’ll need both the Datadog gem (integrated directly into the Rails app) and the Datadog Agent, which runs as a separate process on each dyno. The trace data flow is:
- The Rails app, instrumented by the
datadoggem, generates trace data as it processes web requests and background jobs. - The
datadoggem sends this trace data to the Datadog Agent running on your Heroku dynos, and typically listening on port 8126. - The Datadog Agent then aggregates and forwards the traces it receives from the gem to Datadog’s backend.
Install Buildpack
Since Heroku doesn't offer a one-click Datadog integration, we need to use the Datadog Heroku Buildpack. Heroku dynos are ephemeral, meaning they don’t retain installed services or agents after a restart. The Datadog buildpack ensures that the Datadog Agent is installed and automatically started each time a dyno is restarted for scaling, deployment, or routine cycling.
To install it, run the following:
heroku buildpacks:add \
  --index 1 https://github.com/DataDog/heroku-buildpack-datadog.git \
  -a your-app-name
Buildpack order matters: If you're running a Rails application, you likely already have the heroku/ruby buildpack. The Datadog buildpack needs to be listed before the Ruby buildpack. Setting --index 1 will make it first in the list. The --index flag is 1-based, not 0-based.
You can confirm the buildpack is installed by running the following, your output may look a little different depending on what other buildpacks are already installed:
heroku buildpacks -a my-app

# === my-app Buildpack URLs
# 1. https://github.com/DataDog/heroku-buildpack-datadog.git
# 2. heroku/rubyEnable Dyno Metadata
Heroku dyno names are ephemeral, so their identifiers can change frequently. To maintain continuity of metrics, we need to enable Heroku Dyno Metadata:
heroku labs:enable runtime-dyno-metadata -a your-app-nameThis allows information about the dyno to be used in Datadog for better tracking of metrics and traces. You can verify this feature is now enabled by checking your Heroku environment variables, there should now be several new ones starting with HEROKU..., for example:
heroku config -a my-app | grep "^HEROKU"

# HEROKU_APP_ID:                   abc123...
# HEROKU_APP_NAME:                 my-app
# HEROKU_RELEASE_CREATED_AT:       2025-03-25-07T19:55:21Z
# HEROKU_RELEASE_VERSION:          v1234
# HEROKU_SLUG_COMMIT:              5c8d2...
# HEROKU_SLUG_DESCRIPTION: Deploy 5c8...Configure Agent
The next step is to configure the Datadog agent. This requires setting several environment variables, as explained below:
# Set this if your app uses a Heroku Redis add-on
# Assumes `REDIS_URL` env var is set
heroku config:set DD_ENABLE_HEROKU_REDIS=true -a your-app-name

# Set the Datadog hostname to include app name, dyno type, and dyno number.
# Improves metrics continuity by providing detailed info about dynos.
# This is why we enabled dyno metadata in the previous step!
heroku config:set DD_DYNO_HOST=true -a your-app-name

# Ensures metrics are sent to the correct Datadog site.
heroku config:set DD_SITE="datadoghq.com" -a your-app-name

# Set Datadog agent log level to error to avoid littering Heroku CLI
# and Rails server output with Datadog trace messages.
heroku config:set DD_LOG_LEVEL="error" -a your-app-name

# Add your Datadog API key to Heroku's config.
# Keys are at: https://app.datadoghq.com/organization-settings/api-keys
heroku config:set DD_API_KEY="abc123..." -a your-app-name
Heroku restarts the application every time an environment variable is set. To avoid numerous restarts, you can set multiple environment variables in a single command as shown below:
heroku config:set \
  DD_ENABLE_HEROKU_REDIS=true \
  DD_DYNO_HOST=true \
  DD_SITE="datadoghq.com" \
  DD_LOG_LEVEL="error" \
  DD_API_KEY="abc123..." \
  -a your-app-name
This way the app will only be restarted once.
Apply Buildpack
At this point, the agent isn't running yet. This is because it requires the Heroku slug to be re-built. To do this, add an empty commit and push to your heroku remote:
git commit --allow-empty -m "Rebuild slug to apply Datadog setup"
git push heroku main
From this point onwards, the Datadog Agent will be started automatically when each dyno starts.
You can verify the agent was started successfully by shelling into a Heroku web or worker dyno, and using the agent-wrapper command provided by the Datadog buildpack:
heroku ps:exec --dyno=web.1 -a your-app-name
agent-wrapper statusIgnore the warnings about DD_API_KEY not being set. Heroku doesn't set configuration variables for the SSH session, but the Datadog Agent process is able to access them.
Check the output of the status command to verify the API key you configured earlier is valid, and that the APM agent is running:
API key ending with xxxxx: API Key valid
[...]

=========
APM Agent
=========
  Status: Running
[...]Enable Application Tracing
The next step is to install and configure the datadog gem for the Rails project. Add it to your Gemfile's production group, and optionally staging if you have another environment setup, as shown below:
group :staging, :production do
  gem "datadog", require: "datadog/auto_instrument"
end
I intentionally do not install it in development and test groups because the agent isn't running in those environments, which would result in seeing connection errors every time you run a local Rails server or console. This is because the code in the datadog gem attempts to connect to the agent running on port 8126 to send traces.
Run bundle install to apply the changes.
Auto Instrumentation
The require: "datadog/auto_instrument" in the Gemfile works for supported Ruby frameworks and libraries. This means that the gem will automatically detect calls to controllers, background jobs, ActiveRecord queries, Action Mailer, etc. and send the traces to Datadog. It also instruments every gem in your Rails app that it can. Learn more about Automatic Instrumentation.
Without auto_instrument, you would have to manually instrument your code, which means wrapping every section of code you wanted sent to datadog in trace blocks like this:
Datadog::Tracing.trace(name, **options) do |span, trace|
  # Wrap this block around the code you want to instrument
  # Additionally, you can modify the span here.
  # e.g. Change the resource name, set tags, etc...
end
You can also combine auto and manual instrumentation. For example, if there's a particular section of code that you want further details sent to Datadog that the auto instrumentation isn't capturing, you can still wrap your code as shown above. See Manual Instrumentation for further details.
Once the datadog gem is installed, add a config initializer for further customization. For example:
# config/initializers/datadog.rb
if Rails.env.staging? || Rails.env.production?
  Datadog.configure do |c|
    # set DD logger level to ERROR to reduce log noise.
    c.logger.level = Logger::ERROR

    # set environment tag based on the Rails environment
    c.env = Rails.env.production? ? "prod-my-app-name" : "staging-my-app-name"

    # set version tag, eg: `version:v123`
    c.version = ENV["HEROKU_RELEASE_VERSION"] if ENV["HEROKU_RELEASE_VERSION"].present?

    # optionally capture Sidekiq arguments
    c.tracing.instrument :sidekiq, enabled: true, quantize: { args: { show: :all } }
  end
end
Explanation:
- Rails Environment Check: By wrapping the initializer in a
Rails.env.staging? || Rails.env.production?check, we ensure Datadog configuration only runs in environments where the Datadog agent is running. - Log Level: Even though earlier we ran
heroku config:set DD_LOG_LEVEL="error", I found it necessary to also set the log level in the initializer to fully quiet all the Datadog logs noise. - Environment Tagging: Datadog uses the
envtag to segment and filter application data by environment, like "staging" or "production". Settingc.envtoprod-my-app-nameorstaging-my-app-nameensures that traces, are grouped by environment. - Version Tagging: The
versiontag tracks specific app versions, which is useful for tracing changes across deployments. Here, we pullHEROKU_RELEASE_VERSIONdirectly from the environment. This allows us to see how a particular deployment performs, compare releases, and track down any regressions or improvements made in recent updates. - Sidekiq: Although Sidekiq instrumentation is enabled by default as a result of specifying
auto_instrumentin theGemfile, the arguments passed to theperformmethod will show up in Datadog spans as?. If you want to see the actual values the job is being called with, use thequantizeoption.
There's a lot more that can be done in the config block, including optionally disabling/enabling integrations. See Tracing Ruby Applications for further details.
At this point, we're nearly done with the APM setup. There's just one last step required to tie everything together.
Unified Service Tagging
When the Datadog agent runs on the web and worker dyno's, in addition to sending instrumentation data from the Rails application and background jobs to Datadog, it also sends metrics about the web and worker dynos such as memory and CPU utilization. We need to ensure this information is correctly tagged with the service, environment, and release versions so that the host metrics can be filtered on, and correlated to the APM data. For example, when investigating a particular Rails controller action, it would be interesting to see if there's a memory spike every time it runs.
This requires setting up Unified Service Tagging. The documentation mentions several different ways to set this up, but on Heroku, our team found this easiest to accomplish with a Prerun script.
A Prerun script runs after all of the standard configuration, but immediately before starting the Datadog Agent. Get started by adding the following environment variable:
heroku config:set DD_HEROKU_CONF_FOLDER="/app/.datadog" -a your-app-nameIn this case, Datadog will expect to find a folder named .datadog in your project root (not in the Rails app dir, this will be explained shortly), with an executable file named prerun.sh. In this script, the env, service, and version tags are populated. For example:
# .datadog/prerun.sh

#!/bin/bash

if [ "$RAILS_ENV" == "production" ]; then
  export DD_ENV="prod-my-app-name"
elif [ "$RAILS_ENV" == "staging" ]; then
  export DD_ENV="staging-my-app-name"
fi

export DD_SERVICE="my-app-name"

if [ -n "$HEROKU_RELEASE_VERSION" ]; then
  export DD_VERSION="${HEROKU_RELEASE_VERSION}"
fi

if [ -n "$DD_ENV" ] && [ -n "$DD_VERSION" ] && [ -n "$DD_SERVICE" ]; then
  export DD_TAGS="env:${DD_ENV},version:${DD_VERSION},service:${DD_SERVICE}"
fi
Why the .datadog directory goes in the project root:
On Heroku, your app is deployed within a top-level /app directory, so your project's root directory in the Heroku environment is actually /app. This means that when we specify DD_HEROKU_CONF_FOLDER="/app/.datadog", the .datadog directory should be created in the root of your project repository, not inside the app directory where Rails controllers, models, and views are located.
In other words, your project structure on your laptop will look like this:
.
├── .datadog
│   └── prerun.sh
├── Gemfile
├── Gemfile.lock
├── Procfile
├── ...
└── app
    ├── controllers
    ├── models
    ├── views
    └── ...
But when it runs on Heroku, it looks like this:
.
└── app                   === HEROKU LEVEL APP DIR ===
    ├── .datadog
    │   └── prerun.sh
    ├── Gemfile
    ├── Gemfile.lock
    ├── Procfile
    ├── ...
    └── app               === YOUR RAILS APP DIR ===
        ├── controllers
        ├── models
        ├── views
        └── ...
Deploy
Once you've merged all the changes to the main branch, you can deploy with git push heroku main. Here’s a quick recap of the changes:
- Updated
GemfileandGemfile.lockto include thedatadoggem. - Created
config/initializers/datadog.rbfor Datadog configuration within Rails. - Added
.datadog/prerun.shto consistently tag host metrics with the app's environment, service, and version information.
After deployment, give it a few minutes, then open Datadog’s Infrastructure section in the web UI. Use filters like env:..., service:..., or version:... (as configured in prerun.sh) to verify your host metrics and confirm they are tagged correctly.
Next, go to APM -> Service Catalog -> Select your service, then from the list of resources (which are your Rails controllers and actions), select any Resource Page. This should also display the host metrics, now correlated with specific resource executions. You should also see telemetry data for the Rails app, with each Controller#action instrumented by Datadog appearing as a Resource.
Memory Usage
Since the Datadog agent is another process that will always be running on your dyno's, be aware that it does consume additional memory. Our staging environment was using the Basic dyno type, which only has 512MB of memory, and it started crashing frequently after adding the Datadog agent. To resolve this we had to upgrade to the Standard dyno type. To be fair, it was the Rails app was consuming most of this memory, and adding the Datadog agent just pushed it over the edge.
Although the Heroku web dashboard shows memory consumption, it doesn't break this down by process. To view memory consumption for both the Datadog agent, and the Rails app on either the web or worker dyno's, you can shell in as we did before to check the agent status, then run the ps command, to display processes by descending memory:
heroku ps:exec --dyno=web.1 -a your-app-name
ps auxww --sort=-%memTerminal Visual Cues
A few times during this post, we had to shell into Heroku to check on things. To avoid disasters, I like to change my terminal tab colors to make it obvious that I'm no longer in my own laptop's shell. You can change the terminal tab colors by adding a function to your shell profile (~/.bash_profile or ~/.zshrc), which will adjust the red, green, and blue values of the tab background.
Add the following to your profile:
# Define a function to set the tab color in your terminal
tab-color() {
  echo -ne "\033]6;1;bg;red;brightness;$1\a"
  echo -ne "\033]6;1;bg;green;brightness;$2\a"
  echo -ne "\033]6;1;bg;blue;brightness;$3\a"
}

# Functions to quickly set a specific color.
# Adjust as per your preference.
tab-green() { tab-color 0 255 0; }   # For staging
tab-red() { tab-color 255 0 0; }     # For production

# Function to reset the color back to the default
tab-reset() { echo -ne "\033]6;1;bg;*;default\a"; }
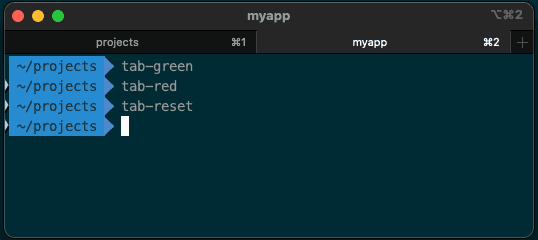
To demonstrate, here is what my regular terminal tabs look like:
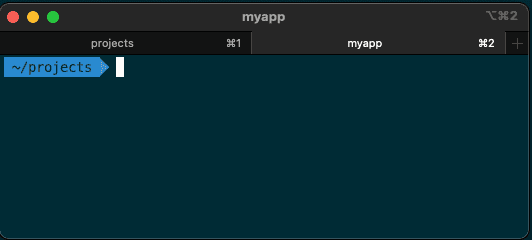
After running the tab-green function:
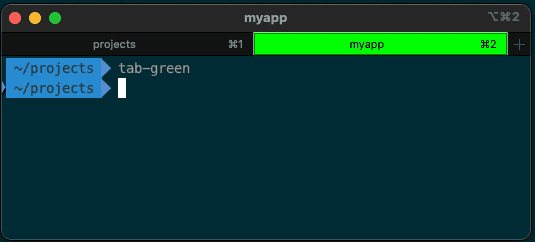
After running tab-red:
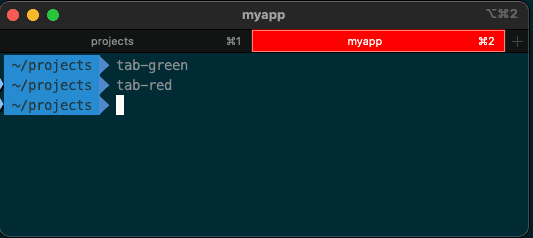
And resetting:
Next, define aliases for shelling into your Heroku environments (for example: staging and production) that will use the tab color functions. My aliases are as follows:
# SSH into Heroku staging dyno and turn tab green
alias hss='tab-green && heroku ps:exec --dyno=web.1 -a your-staging-app'

# SSH into Heroku production dyno and turn tab red
alias hsp='tab-red && heroku ps:exec --dyno=web.1 -a your-production-app'
If using ohmyzsh, add the above aliases to ~/.oh-my-zsh/custom/aliases.zsh. Otherwise add them wherever you usually add aliases.
Customize the aliases for whatever you'll remember. For me I think of:
heroku shell staging
heroku shell production
Now whenever you shell into either staging or production, you'll have a strong visual cue that you're in a deployed environment.
Summary
In this guide, we walked through integrating Datadog APM for a Rails application hosted on Heroku. Key steps included adding the Datadog buildpack, enabling Heroku dyno metadata, configuring environment variables for the Datadog agent, setting up unified service tagging, and setting up auto instrumentation in the Rails application with the datadog gem. We also learned that you can shell into a Heroku dyno, and useful tips for terminal tab management.
References:


